From $297k Spend to $3.9M in Generated Pipeline
In total generated revenue
ROI on marketing
spend
Revenue growth in 2024 projection
For a sales-led B2B SaaS company with complex, multiple stakeholder sales cycles averaging 3-12 months, understanding the true ROI of paid media requires more than surface level metrics. This audit examined two years of paid media performance and sales funnel data, revealing how $297k in marketing spend generated $3.9M in qualified pipeline and drove 66% of new business revenue, while uncovering critical conversion bottlenecks that, once addressed, could dramatically improve performance.
Leadership team needed clarity on three critical subjects:
I conducted a comprehensive 2 year trend analysis examining:
✅ TOFU performance - Traffic, CPC benchmarks, HMQLs, and early-stage conversions
✅ MOFU performance - MQL to SQL conversion rates, qualification criteria, and velocity metrics
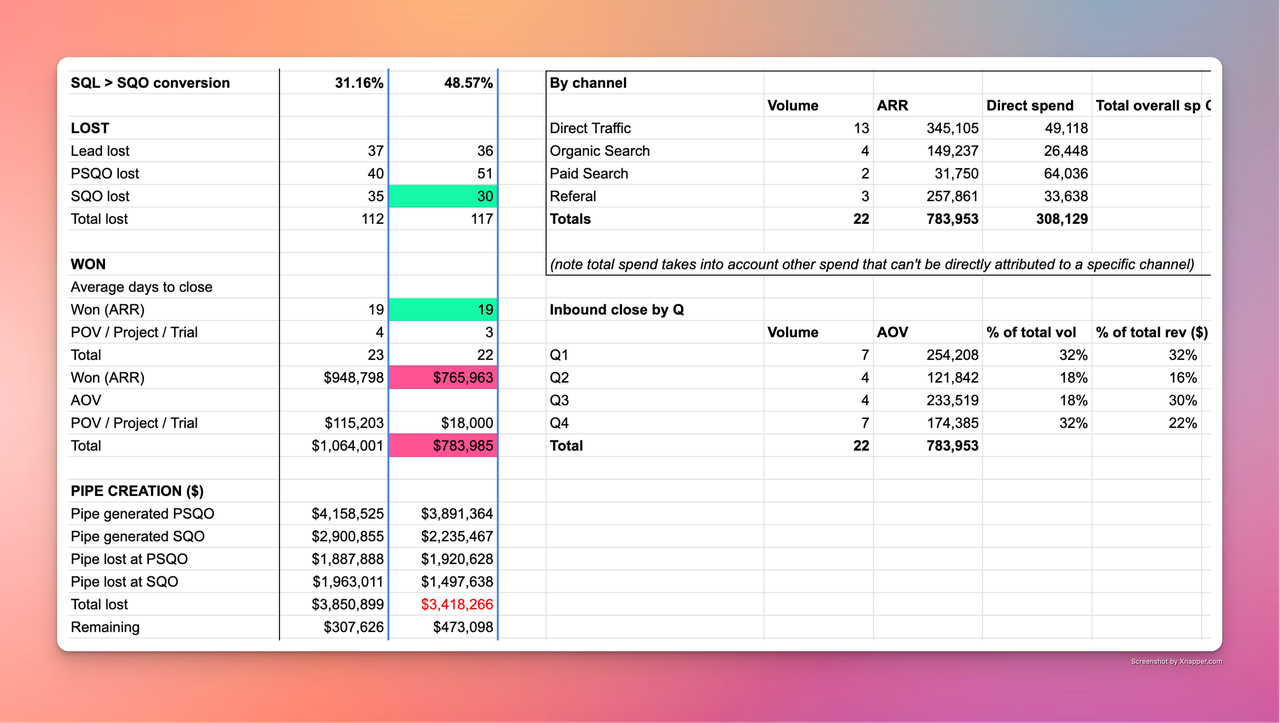
✅ Pipeline data - PSQO/SQO generation, win/loss analysis, and channel attribution
✅ Financial performance - Spend efficiency, CPA, ACV, CAC payback periods, and ROI calculations
Key finding: While traffic dropped 28% YoY (458k → 328k sessions), conversion quality improved significantly.
Insight: The decline in lead volume was offset by a marked improvement in lead quality. This indicates that tighter targeting, increased investment in remarketing, and stronger qualification processes were working.
The investigation uncovered that:
→ Stricter qualification criteria were implemented mid-2023
→ SQLs were redefined to only count after scoping calls (PSQO stage)
→ Many leads were stuck in "Sales Lead" status without proper nurturing
Key finding: MQL to SQL conversion plummeted from 30% to 15% YoY, but this revealed a critical process improvement.
Impact: While conversion rates appeared worse, the SQL win rate nearly doubled 12% → 21%, proving that quality trumped quantity.
Key finding: Despite generating substantial pipeline, conversion to closed deals remained challenging.
Insight: Paid media was generating pipeline but company struggled with mid-funnel engagement and closing, particularly in Q4 2023.
Inbound → 22 customers (69% of volume), $784k revenue (66% of total)
Outbound → 6 customers (19% of volume), $167k revenue (14% of total)
Referral network → 3 customers (9% of volume), $176k revenue (15% of total)
Customer success → 1 customer (3% of volume), $55k revenue (5% of total)
Google ads → 13 customers, $345k ARR (CPA: $3,778)
Paid social (Remarketing) → 4 customers, $149k ARR (CPA: $6,612)
Paid social (Demand creation) → 2 customers, $32k ARR (CPA: $32,018)
Direct (uncovered traffic) → 3 customers, $258k ARR (CPA: $11,213)
Insight: While paid social had the highest CPA, it played an important role in demand creation and assisted conversions not captured in last-touch and linear attribution.
Key finding: Tier 1 accounts showed significant improvement potential.
Insight: Despite lower volume, Tier 1 accounts needed focused attention to improve ACV and win rates.
Based on the analysis, I developed realistic 2024 targets that balanced growth ambitions with demonstrated conversion rates.
Sessions: 425,000 (+30% YoY)
HMQLs: 340 (+72% YoY)
MQLs: 1,160 (+65% YoY)
SQLs: 143 (+36% YoY)
Won Deals: 31 (+41% YoY)
Note: In addition to setting targets, we established benchmarks for MQL cost by channel and location but for highly relevant keyword sets and audience types. These benchmarks were defined specifically to make unit economics works and ensure campaigns remained profitable.
ARR Goal: €1.8M
Marketing Budget: €305k
ROI Target: €785k (excluding team costs)
Target CAC: €9,800 - 34.67% improvement from previous (cca. €15,000)
Action: Develop targeted mid-funnel content (case studies, ROI calculators, industry benchmarks)
Expected Impact: Improve MQL→SQL from 15% to 25%
Measurement: Weekly MOFU conversion tracking
Action: Introduce "inbound-influenced" attribution model alongside last-touch
Expected Impact: Better visibility into paid media's true influence
Measurement: Quarterly attribution analysis
Action: Deploy ABM strategies using 6Sense data for tier 1 targets
Expected Impact: Increase tier 1 SQL percentage from 27% to 35%
Measurement: Monthly tier mix analysis
Action: Redefine "Sales Leads" stage with clear SLA for follow-up
Expected Impact: Reduce leads stuck in limbo by 50%
Measurement: Lead velocity and aging reports
Action: Reallocate budget based on assisted conversion analysis
Budget Reallocation:
✅ SQL conversion rates increased by 35%
✅ Pipeline velocity reduced by 12 days on average
✅ Marketing influenced revenue trackable at 70% (vs. 66% last-touch only)
Revenue: €1.8M ARR (130% growth)
Efficiency Gain: CAC reduction of 35%
Win Rate: Improve from 21% to 26%
ROI: 2.6x marketing spend (up from 2.4x)
By reducing SQL volume while improving paid traffic quality and lead qualification criteria, win rates improved by 75%. This underscores why you must track performance and model your unit economics across the entire funnel, from first session to closed-won.
Single-touch attribution significantly undervalued paid media's contribution. Multi-touch revealed paid search and paid social influenced 45% of all closed deals despite showing only 2 direct attributions.
Companies often focus on top of funnel growth or bottom of funnel sales enablement, but the middle of the funnel where consideration happens determined success.
Tier 1 accounts had lower initial conversion rates but represented the highest growth potential. Strategic patience and targeted nurturing were essential.
Improving the SQL definition and qualification process delivered more impact than the previous year's 29% budget increase.
Analysis Tools: Advanced excel modeling, SQL queries via HubSpot API
Attribution Modeling: Custom multi-touch attribution using UTM parameters and 6Sense intent data
Visualization: Hubspot dashboards for company executives
This audit transformed how the company evaluates their paid media investment. By moving beyond surface level metrics to understand the full customer journey, we found the real opportunity wasn’t in generating more traffic or endlessly introducing new tactics. Key success for every PPC strategy is to understand funnel performance, focus on the right data, uncover high-leverage insights, and build paid media strategy around profitable unit economics.
The shift from volume focused to quality focused targeting, combined with tighter sales and marketing alignment, improved attribution modeling, and benchmarks we set to keep paid media profitable. All of that positioned the company to achieve 130% in revenue growth with only a modest increase in marketing spend.
Most importantly, this analysis established a framework for continuous improvement, with monthly tracking against targets and quarterly strategy adjustments based on performance data.
Let's discuss how data-driven paid media optimization can accelerate your growth.
Book a Discovery Call


.webp)